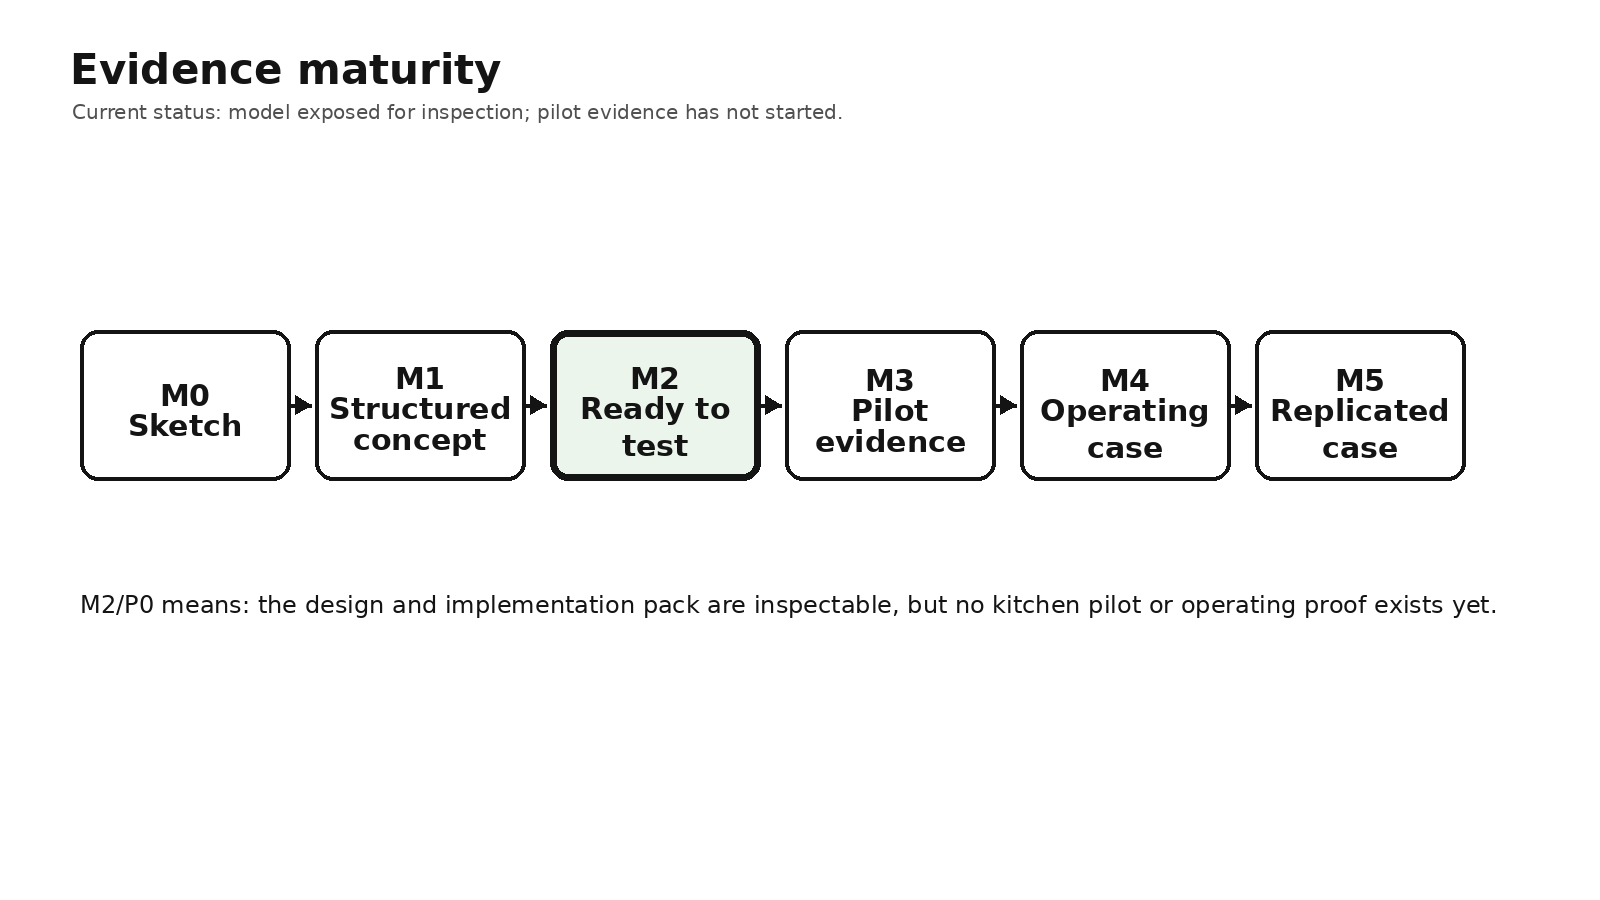
Evidence maturity: M2/P0 — a model ready to inspect, not a business already proven in operation.
Plainly: this is a public design case. It is not proof that a 100 Burger a Day restaurant is already operating, not proof that the 99 DKK combo works in the real world, and not proof that a farmer has already earned more from this exact model.
M2 means the model is detailed enough to inspect: quantities, ledgers, diagrams, kill conditions, supplier interfaces and a pilot plan are exposed. P0 means the pilot evidence has not started: no kitchen run, no supplier test, no sold-out service day and no observed secondary-product channel yet.
So the article should be read as: here is a structured business object that may be worth testing, not: here is a validated business.
The article uses a few short evidence words. Design means a deliberately chosen rule. Modeled means calculated from the current model. Scenario means a stress-test input, not a measured fact. Derived means arithmetic from stated assumptions. Open means the test has not been passed yet.
The question
Can a small burger business deliberately stop at 100 premium combos per opening day, pay a farmer more by using the whole animal better, and still remain worthwhile for a small owner-operator team?
100 Burger a Day is not a restaurant launch announcement. It is a deliberately constrained productive-unit design published so somebody else can inspect it, test it, build it, or show where it fails.
The Model in Two Minutes
What is the idea?
A small burger unit exposes only 100 premium sale tokens per opening day. The reference combo is a burger, tallow fries and house soda tested at 99 DKK including VAT.
Why stop at 100?
The cap makes inventory, human work and supplier demand finite enough to inspect. Sold out means sold out; recovery/QC inventory is tracked separately and cannot silently create burgers 101–104.
Why the whole animal?
A cow is not 400 burger patties. If the restaurant wants to pay the farmer more by using the animal better, the rest of the animal must have real buyers and real net value.
Can 99 DKK work?
Still plausible, but not passed. The price cannot be judged from the burger alone. The model only works if the menu, the whole-animal cost, non-beef ingredients, human work and secondary products all clear the same ledger. In the paper this is called K1, the economic-viability kill condition, and it remains open.
What is the hardest economic problem?
At five sold-out opening days, the design requires about 1.25 animals/week and produces roughly 221 kg/week of secondary edible output that must move through credible channels.
What are we giving away?
The paper and implementation pack expose the design logic, economic boundaries, pilot protocol, supplier interfaces and failure tests so another operator can try the model without needing permission from Hedegreen Research.
Why Stop at 100?
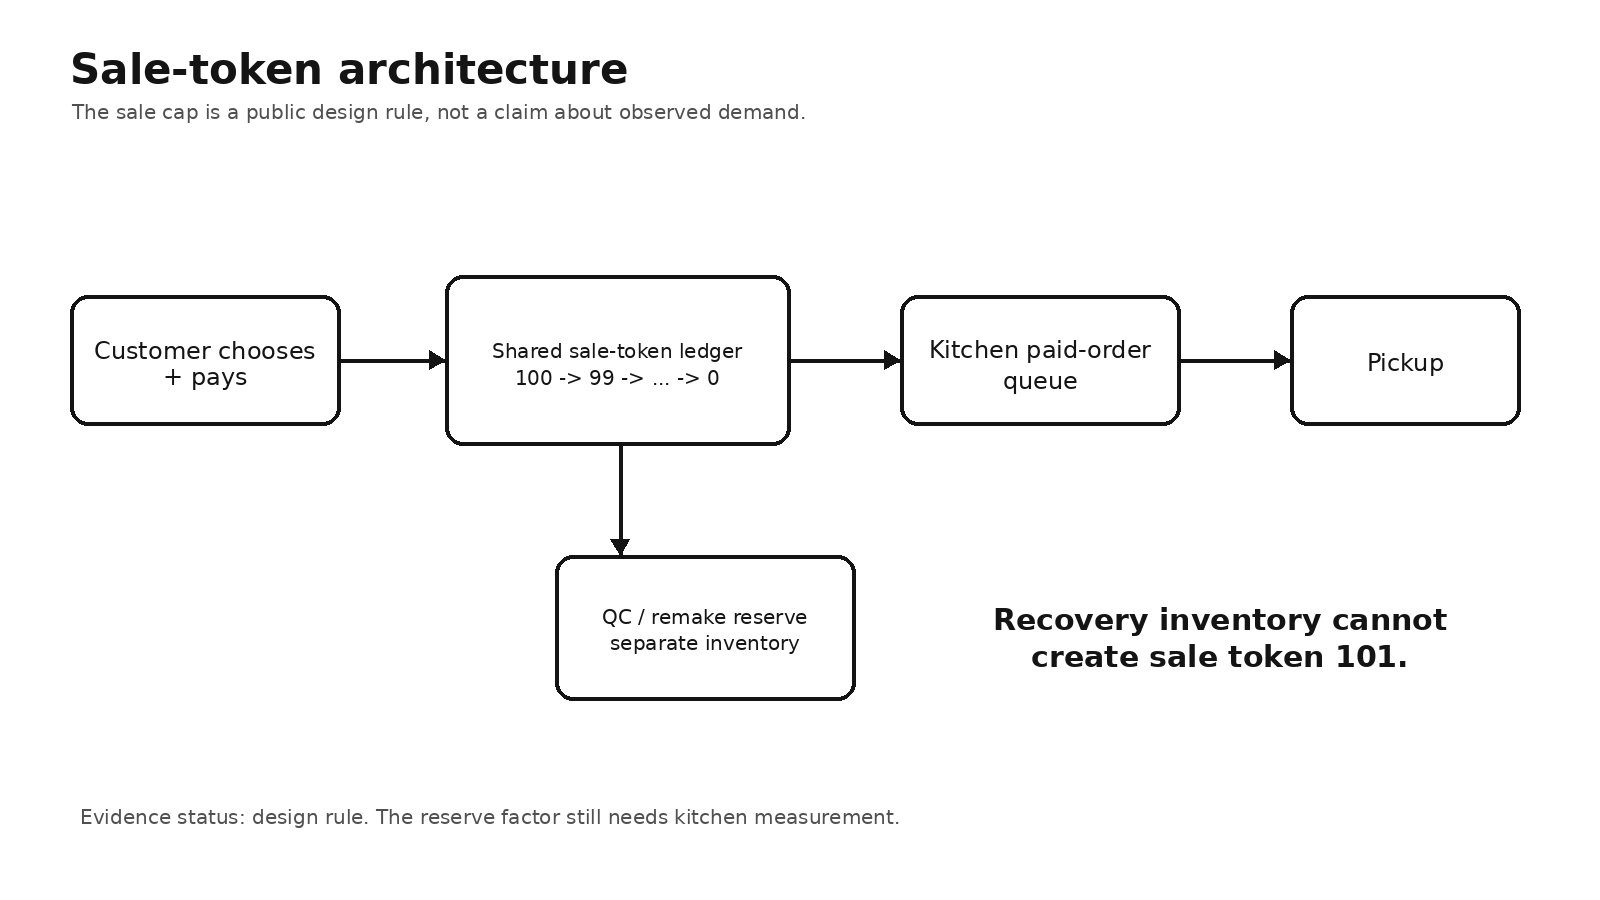
The reference unit exposes exactly 100 premium sale tokens per opening day. The cap is not scarcity marketing. It is a design constraint for readable inventory, bounded production, upstream planning and a clean stopping condition.
Sale inventory is separated from recovery inventory. A kitchen may hold extra patties for a failed quality check, remake, taste check or staff meal, but those do not become extra premium sales.
For planning, the current carcass model produces about 413 nominal 140 g patties and applies a ~3% provisional planning allowance, resulting in roughly 400 saleable planning burgers per reference animal. The allowance is a scenario placeholder, not observed waste.
Why Start With the Whole Animal?
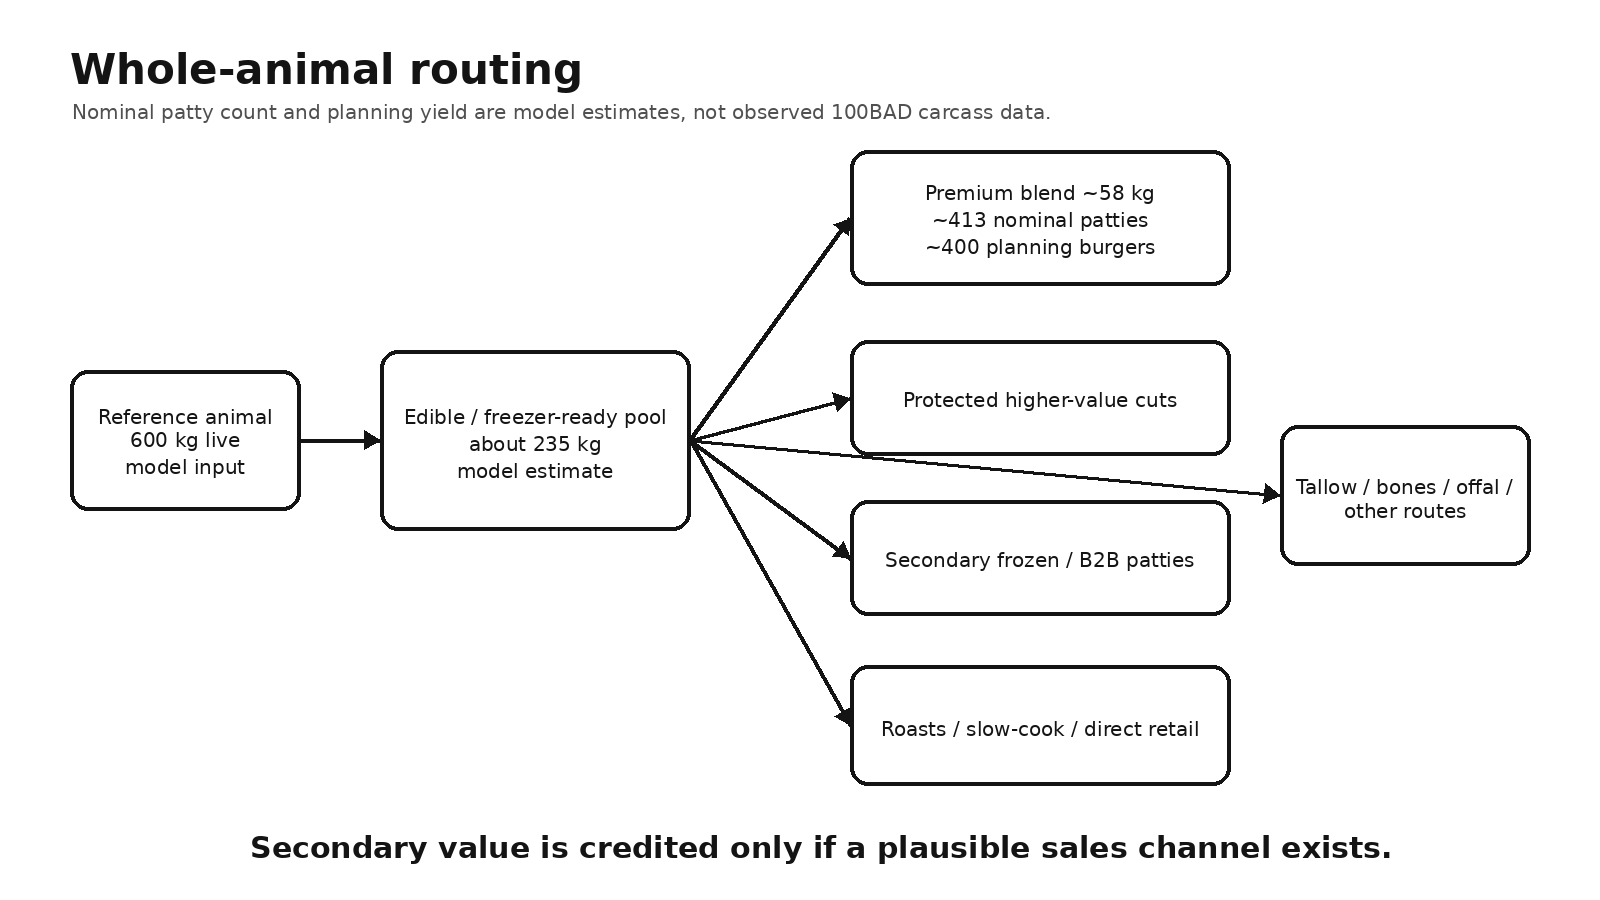
The burger is the anchor product; the animal is the modeled unit of production.
The current reference uses a 600 kg live animal and an aggregate edible/freezer-ready pool of about 235 kg. About 58 kg is routed into the premium burger blend in the current model. Other cuts and products must retain plausible routes rather than being treated as free value.
The hard rule is:
Secondary value is credited only if a plausible channel exists.
Paying the Farmer More Must Share the Same Ledger
The dated reference carcass benchmark is approximately 15.52k DKK for the modeled reference carcass. The paper tests a +15% gross farmer-payment scenario, bringing that to approximately 17.85k DKK.
The difference is about 2,328 DKK per animal — roughly 2,900 DKK/week at five sold-out days.
That premium is not a separate moral bonus outside the economics. It lives inside the same whole-animal landed-cost ledger as processing and every other cost.
Across the modeled secondary pool, about 13.1 DKK/kg net secondary contribution would be enough to offset only the +15% farmer-premium delta. That is not the whole-business break-even threshold.
The farmer question is therefore practical, not rhetorical: after any extra requirements, does the farmer actually keep more money? In the paper this is called K3, the farmer-net-benefit kill condition, and it remains open.
Can 99 DKK Actually Work?
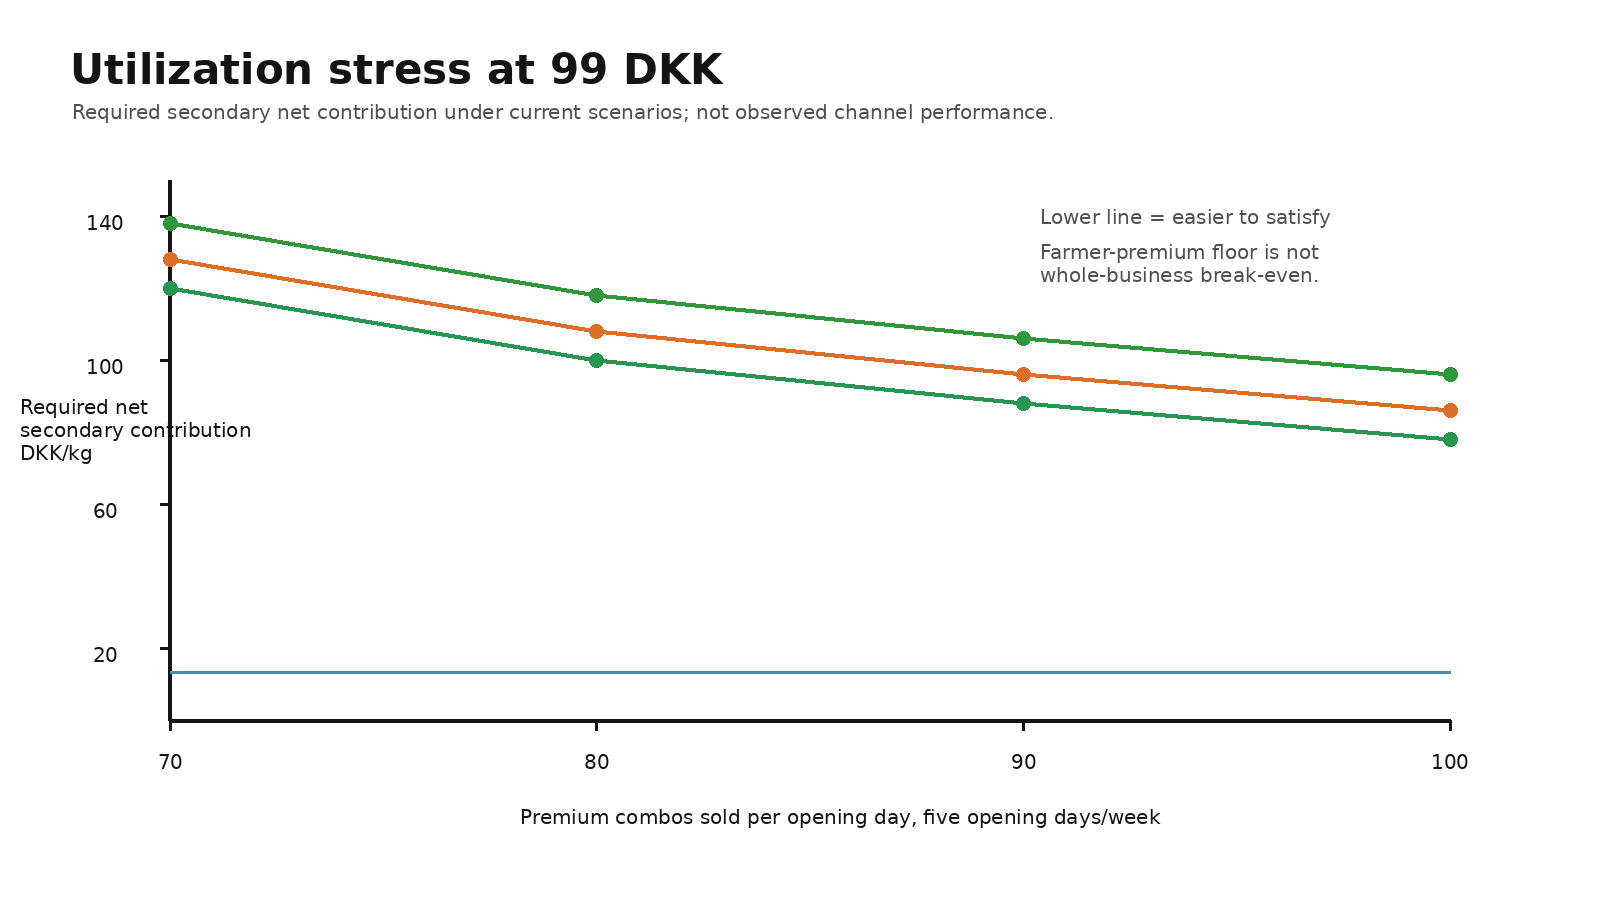
The old draft's single ~70-sales/day break-even number has been retired. It relied on an opaque food-cost placeholder that could not be reconciled safely with the separate farmer-premium model.
The central issue is that the 99 DKK combo cannot carry the whole animal by itself. The rest of the animal must create real net secondary contribution: money left after direct channel costs, not just gross sale value.
The current model uses one weekly identity:
premium menu revenue + net secondary contribution − whole-animal landed cost − non-beef food/packaging − owner labour − support − other variable cost − fixed overhead = economic surplus
Under the current illustrative inputs, at 100 sales/day with an 18 DKK/combo non-beef food + packaging scenario, the design requires about 78.3 DKK/kg net secondary contribution for weekly economic break-even.
This is a scenario threshold, not observed channel performance. It says what the model would need under those assumptions; it does not show that the market can deliver it.
Therefore:
99 DKK remains mathematically possible in the model, but economic viability has not passed. It depends on K2: whether the secondary products can actually move through real channels with enough net value.
Can Two People Run It?
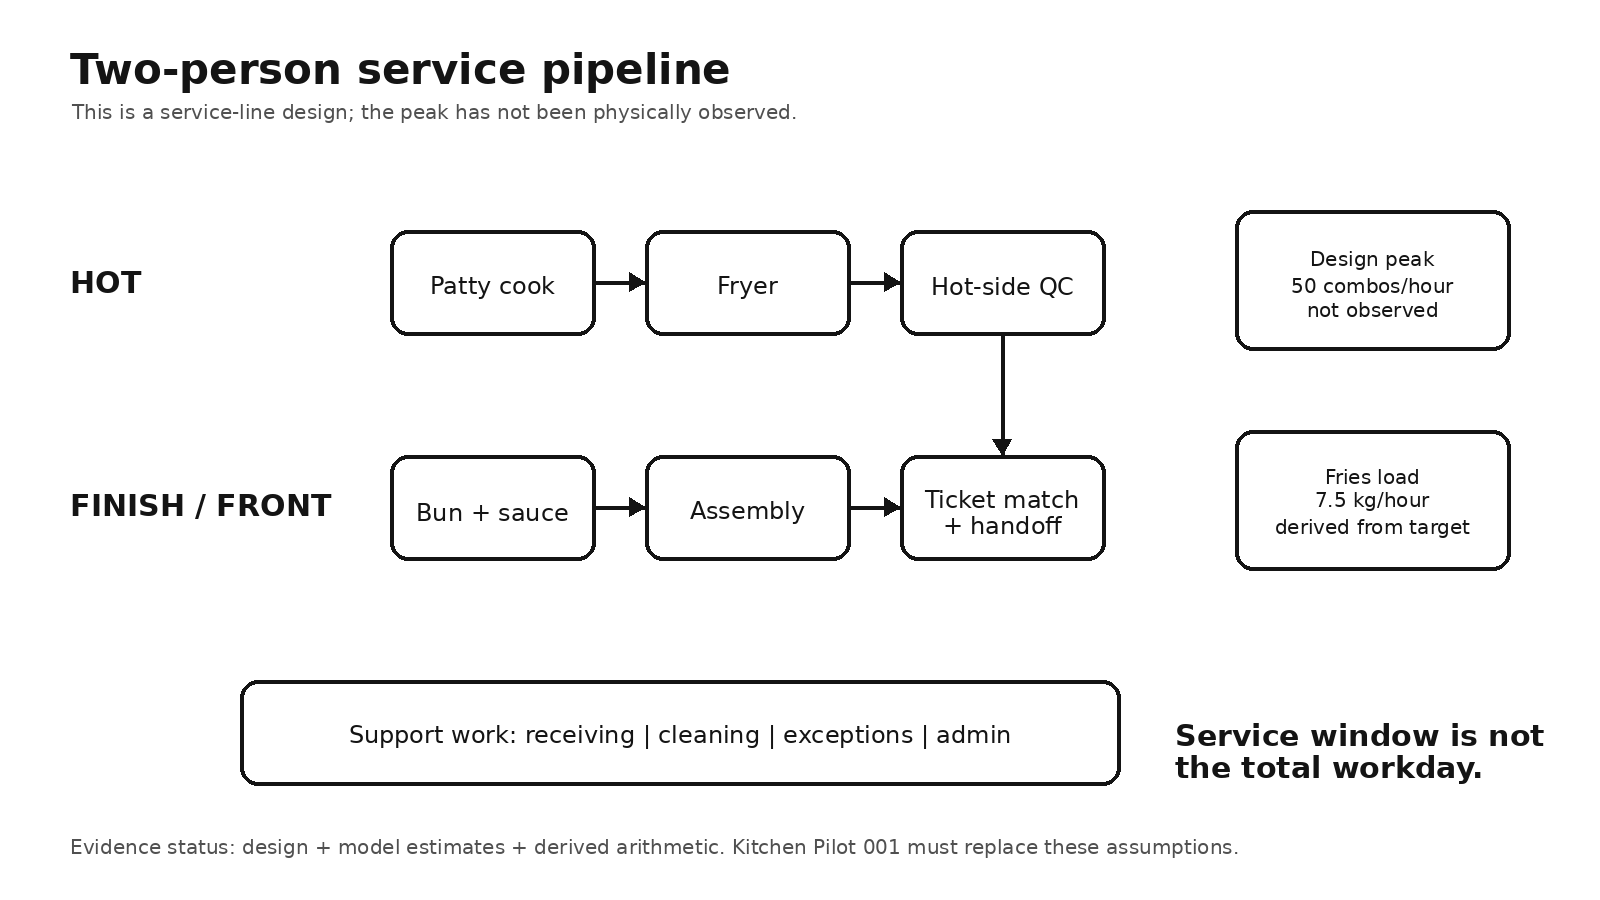
This section is about whether the work could fit two people without hiding labour. It is not a measured shift report. The reference architecture separates hot production from finish/front work. A two-operator system is the baseline. The current peak target is 50 combos/hour, but that target has not been physically observed.
The customer-facing service window is not the workday. Prep, receiving, close, cleaning, admin and exceptions all count.
Kitchen Pilot 001 is designed to test the physical line with 20 sale tokens plus explicit QC/remake inventory before any claim of operational validation.
What Must the Local Network Provide?
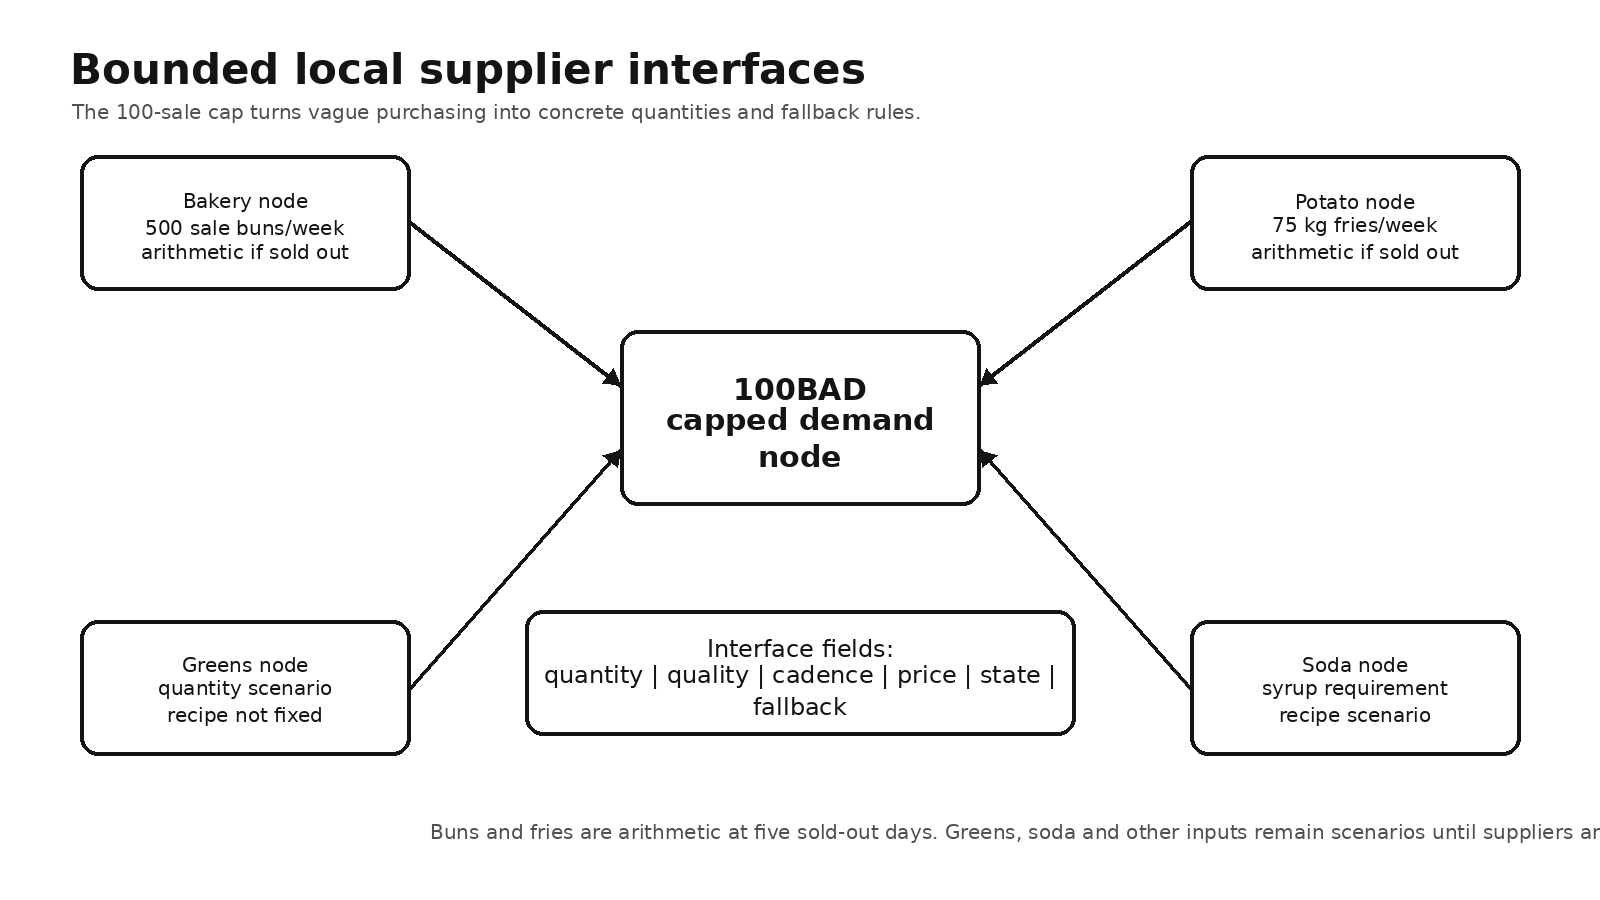
At five sold-out opening days, the cap translates into bounded upstream demand, including approximately:
- 500 sale buns/week;
- 75 kg served fries/week;
- other input requirements that remain scenarios until suppliers and recipes are fixed.
Supplier interfaces specify quantity, quality, cadence, price, state and fallback. The purpose is not for Hedegreen Research to own suppliers; the local businesses remain independent.
Coordination Without Headquarters
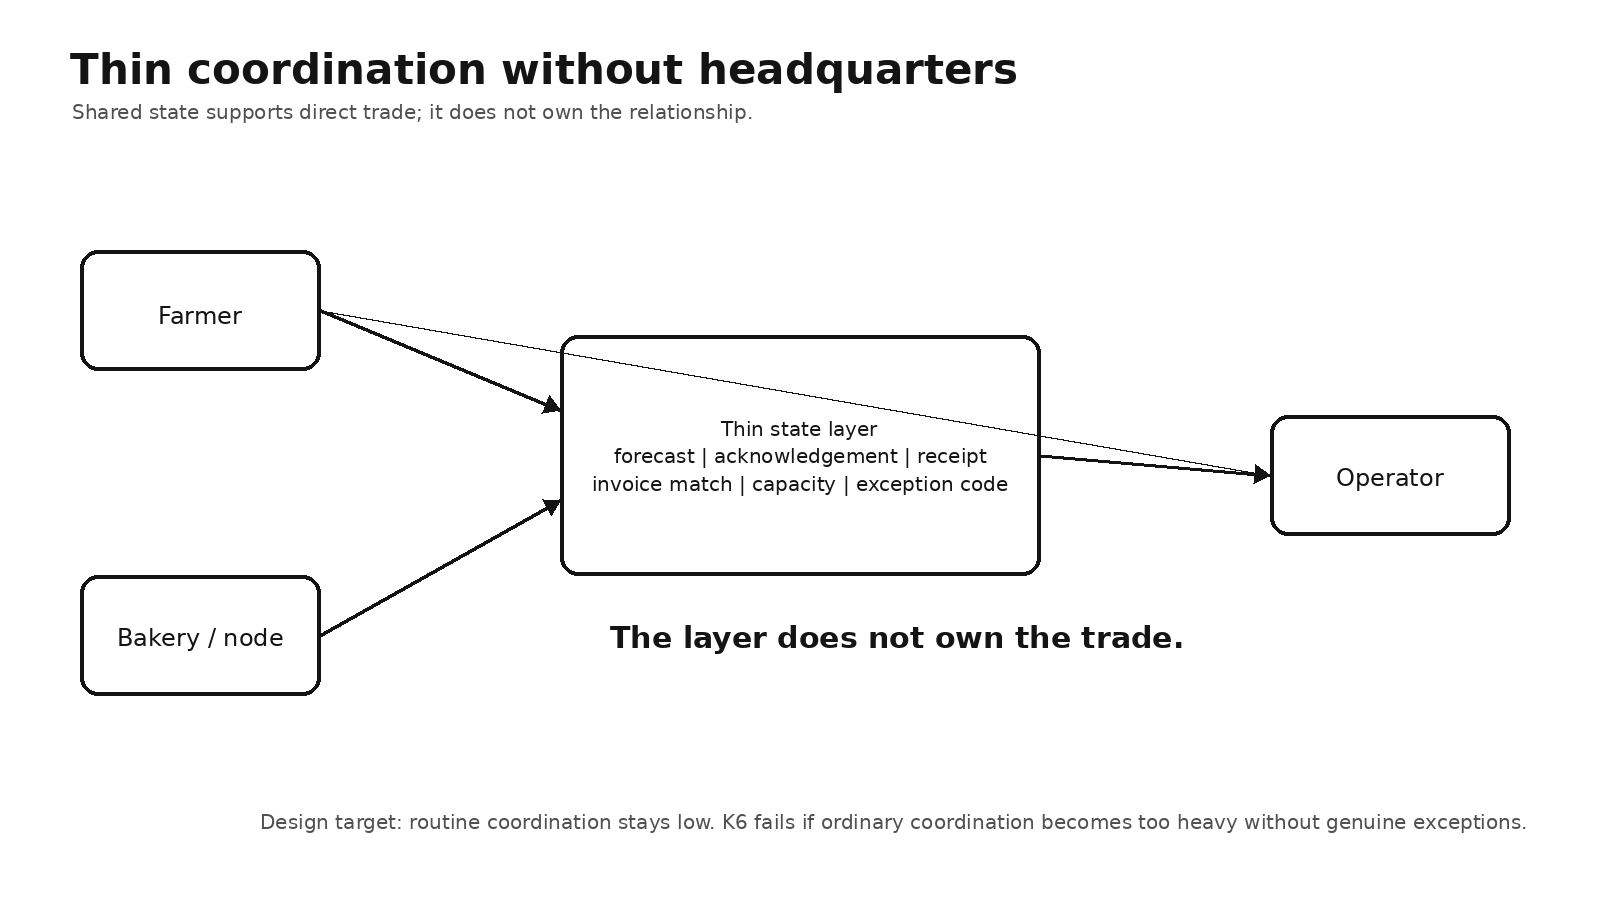
The proposed coordination layer shares operational state — forecast, acknowledgement, receipt, capacity, invoice match and exception codes — while commercial relationships remain direct between participants.
The design target is low routine owner coordination, not central ownership of every transaction.
The Six Ways This Model Can Fail
The paper uses named kill conditions instead of treating every assumption as something to defend. A kill condition is a failure test. Open means the test has not been passed yet.
K1 — Economic viability: the unified menu + secondary ledger cannot cover all economic costs. OPEN / CONDITIONAL.
K2 — Secondary absorption: secondary outflow/value cannot meet the required mass-balance and ledger conditions. OPEN; quantitative floors exist, real sell-through does not.
K3 — Farmer net benefit: incremental farmer-side obligations consume the gross farmer premium. OPEN; current ceiling is ~2,328 DKK/animal.
K4 — Human time: total human work materially exceeds the bounded-work target.
K5 — Quality/throughput: the 50/hour peak target causes unacceptable quality or safety loss.
K6 — Coordination: routine owner coordination exceeds the design failure threshold absent real exceptions.
The kill conditions are not equally mature. A numeric threshold is not the same thing as observed evidence.
Would This Work Outside Denmark?
This case is calibrated to Denmark. The architecture may be portable; the price point is not assumed to be.
A cross-country test would need to localize menu price, tax/VAT, labour, rent, cattle economics, processing and the realizable value of secondary products. That is future work rather than evidence claimed by Case 001.
Read the paper
100 Burger a Day — Market Gaps, Case 001 — Release Candidate 01
Open the current fixed Camelot paper PDF
Try the model
The Market Gaps TID door keeps the public case boundary, fixed Camelot paper and working materials together. Start there if you want the object rather than only the article.
The Public Data Pack contains the evidence boundary, unified economics, Kitchen Pilot 001, supplier-node specifications, coordination model, replication material, data tables and the economic calculator. Fixed PDFs are kept separately in Camelot.
Download the Public Data Pack v1.1 ZIP directly
The pack is designed to remain useful without contacting Hedegreen Research. If somebody builds the idea commercially, that is consistent with the purpose of Market Gaps. Formal reuse terms for the published materials are still being finalized.
Market Gaps
Market Gaps publishes productive structures that appear missing, undersupplied, badly coordinated or needlessly centralized. The goal is not to make the idea itself scarce. The goal is to make the structure legible enough that somebody else can test it.
If the model is wrong, the next operator should be able to show us where. If it is right, they should not need our permission to build it.